
UNIT 15
Day 113 (6.15-1, 6.15-2, & 6.15-3) Statistics & Measures of Central Tendency
Watch Videos on Friday, May 8 - Complete assignments by May 11
Statistics
The collection, organisation, presentation, interpretation and analysis of data.
A statistic is a single number, computed from a sample, that summarizes some characteristic of a population.
A statistic is a single number, computed from a sample, that summarizes some characteristic of a population.


|


|
|
|
|


|


|
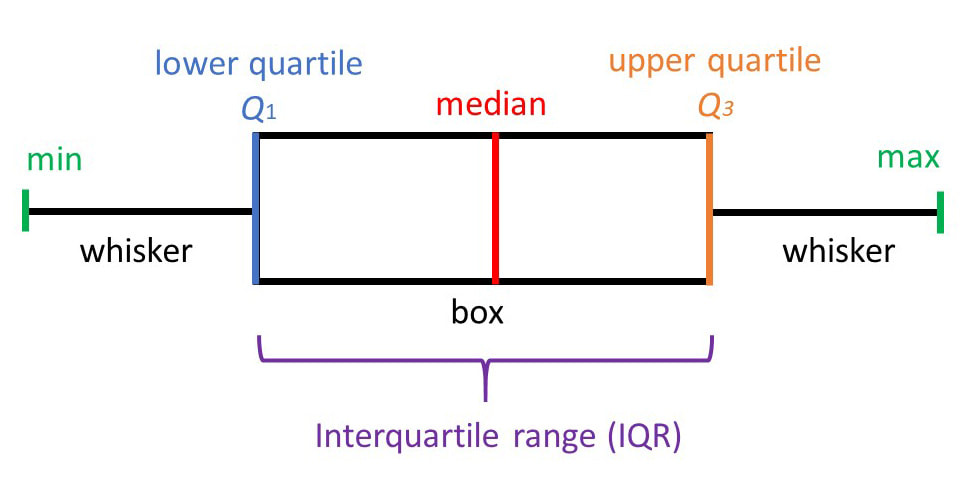
Day 114 (6-16-1 & 6.16-2) Frequency Tables, Histograms, & Box Plots
Watch Videos on Monday, May 11 - Complete assignments by May 12


|


|
|
|
|


|


|
Day 115 (6.16-3) Measures of Variabililty
Watch Video on Tuesday, May 12 - Complete assignments by May 13


|

|
|
|
|


|


|
Day 116 (6.16-4) Appropriate Use of Statistical Measures
Watch Video on Wednesday, May 13 - Complete assignments by May 14
Measures of Central TendencyMeasures of central tendency are numbers that describe the "middle" of the data.
Each measure has specific strengths and weaknesses.
There are times when one measure of central tendency will better describe the data.
|
Measures of Variation or VariabilityNumbers that describe how "spread out" the data is
There are times when one measure of variability will better describe the spread or variation of the data.
|

|

|

|

|
|
|
|
Day 117 (6.16-5) Summarize Data Distributions
Watch Video on Thursday, May 14 - Complete assignments by May 15
DATA DISTRIBUTION
How “evenly” the values are spread either side of the average.
Skewed Distribution
Asymmetrical - stretched or distorted in one direction

|

|
|
|
|
Unit 15 Assessment
Take the Online Test Only after you have completed every assignment

|